You can add tables and graphs into the content boxes as images. Creating images of your tables and graphs will allow conference visitors to tap or click on them and expand them to their full size for easy reading.
Ensure that your images are as large as possible (up to 1920×1080). See this FAQ for more information on adding images to your iPoster: How do I add images to an iPoster?
1. To make an image of your table or graph: firstly create your table or graph in a spreadsheet, presentation, or word-processing program. Here is an example of an image within a PowerPoint presentation. I’m going to use the Microsoft snipping tool to take a ‘snip’ of this image – this tool is available if you use Microsoft. If you’re on a Macbook use the following keyboard shortcut to take a screenshot: shift+Command+4.
2. Alternatively, right click on the image and save it as a PNG or JPEG. Do not try to copy and paste the image directly from the source into the iPoster editor.
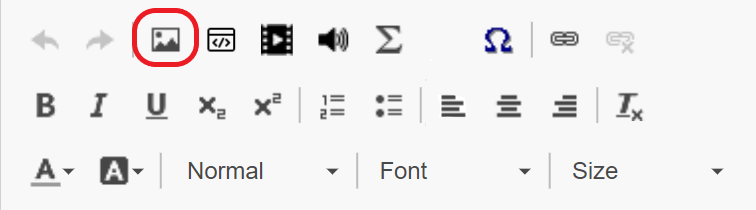
3. Click inside the content box where you want the graph/table to sit. Use the INSERT IMAGE button to upload your image of it. See the FAQ: How do I add images to an iPoster? for more information.
Need further assistance? Reach out to our support team; send us a request using our support desk contact form and we will get back to you as soon as we can. Don’t forget to let us know which conference you’re creating a presentation for.